Multi Trading Charts Review: The Ultimate Free 4x4 TradingView Grid Layout Tool
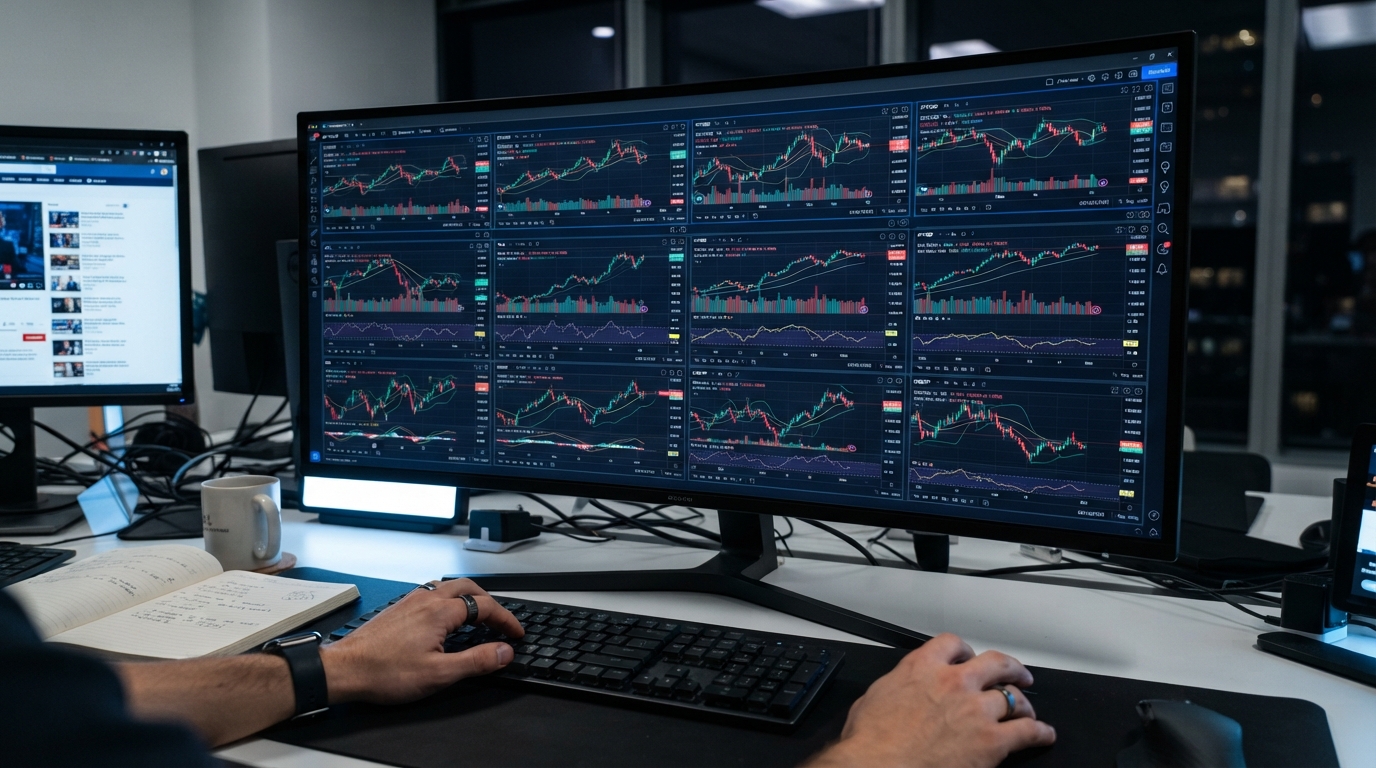
For discerning traders navigating the volatile currents of cryptocurrency, forex, and equity markets, the ability to monitor multiple assets across varying timeframes simultaneously is not a luxury—it’s a strategic imperative. Traditional charting platforms often compartmentalize this critical functionality behind prohibitive premium subscriptions, a cost that can erode the capital of retail participants.
Enter Multi Trading Charts (https://multitradingcharts.com/), an innovative, browser-native solution that democratizes access to professional-grade multi-chart layouts. Developed as a 100% free utility, it seamlessly integrates live TradingView grids without demanding any account registration or recurring fees. This review delves into how Multi Trading Charts empowers a more comprehensive and efficient approach to cross-market analysis.
Understanding Multi Trading Charts
Crafted by the Appzilla Team, Multi Trading Charts functions as a highly responsive, web-based dashboard designed to stream and display up to 16 live financial charts concurrently. By leveraging the robust TradingView embed ecosystem, the platform effectively bridges the operational gap between sophisticated institutional terminals and the accessibility requirements of independent traders.
Core Specifications
| Feature Category | Platform Detail |
|---|---|
| Cost Structure | Completely Free (No hidden fees or tiered subscriptions) |
| Access Requirements | No registration or login needed; instant browser deployment |
| Maximum Chart Layout | Up to a 4x4 grid matrix (16 individual chart windows) |
| Supported Markets | Cryptocurrencies (spot and futures), Global Stocks (NYSE/NASDAQ), Forex pairs, Major Indices, Commodities |
| Primary Charting Engine | Official TradingView Widgets |
Key Analytical Advantages
1. Dynamic Grid Configurations
The hallmark of Multi Trading Charts is its unparalleled flexibility in screen real estate management. Users can transcend the limitations of single-tab viewing by creating highly customized grid matrices:
- Adaptive Layouts: Options range from fundamental dual-chart splits (2x1) and conventional quadrant views (2x2) to advanced nine-chart arrays (3x3) and extensive institutional-scale monitoring (4x4).
- Intuitive Management: Each chart window includes dedicated controls for adding new tickers or instantly minimizing or removing existing viewports, streamlining the analytical workflow.
2. Integrated Multi-Timeframe and Cross-Asset Analysis
The platform’s direct link to real-time market data facilitates integrated analysis across diverse financial instruments:
- Granular Trend Decomposition: Traders can simultaneously observe a single asset’s price action across multiple timeframes—for instance, Bitcoin’s Daily, 4-Hour, 1-Hour, and 15-Minute charts—to identify confluence or divergence in trends.
- Correlation Tracking: Users can dedicate specific grid slots to highly correlated assets, such as Bitcoin and Ethereum, while simultaneously monitoring key macro indicators like the DXY (US Dollar Index) or the S&P 500 to gauge broader market sentiment and liquidity shifts.
3. Expedited Symbol Discovery and Deployment
Multi Trading Charts simplifies the process of adding new assets, eliminating the need for manual code manipulation. Its integrated Smart Symbol Search Popup allows users to quickly input a desired ticker (e.g., BTCUSDT, ETHUSDT, EURUSD), search the comprehensive asset index, and deploy the corresponding chart directly into their chosen grid slot.
4. Optimized Visuals and Individual Controls
Recognizing the 24/7 nature of financial markets, the dashboard incorporates a native Dark Mode toggle. This feature re-renders the entire interface in a true black aesthetic, significantly reducing eye strain during prolonged monitoring sessions. Furthermore, each independent chart window offers rapid shortcuts, including a "Fullscreen" option for focused analysis and immediate return to the grid view.
Streamlining Your Multi-Chart Trading Cockpit
Setting up a personalized, multi-market analysis environment on Multi Trading Charts is designed for speed and simplicity:
- Access the Platform: Navigate directly to https://multitradingcharts.com/home.
- Define Grid Dimensions: Utilize the on-screen inputs to select or type the desired number of columns and rows for your optimal viewport density.
- Populate Charts: Click into any active grid segment, activate the integrated search modal, and select your preferred cryptocurrency pairs, forex instruments, or stock tickers for immediate display.
- Enhance Visuals: Engage the dark theme toggle for superior contrast and reduced visual fatigue during extended charting periods.
Summary
Multi Trading Charts stands as a compelling solution for traders who require extensive multi-chart capabilities without the burden of subscription fees. Its robust integration with TradingView, coupled with a highly intuitive, browser-based interface, provides a powerful and private analytical environment. For active day traders, scalpers, and technical analysts who prioritize comprehensive market oversight and cross-asset correlation tracking, this free utility offers an indispensable foundation for informed decision-making.
Resources
- Multi Trading Charts: https://multitradingcharts.com/
- Let's Chat Crypto: https://letschatcrypto.com/multi-trading-charts-review (Publisher of this article's brief)
- Appzilla Team: Developers of Multi Trading Charts (as mentioned on the platform's introductory information).
Details
Author
Top articles





 }})
You can now watch HBO Max for $10
Latest articles




You can now watch HBO Max for $10
For discerning traders navigating the volatile currents of cryptocurrency, forex, and equity markets, the ability to monitor multiple assets across varying timeframes simultaneously is not a luxury—it’s a strategic imperative. Traditional charting platforms often compartmentalize this critical functionality behind prohibitive premium subscriptions, a cost that can erode the capital of retail participants.
Enter Multi Trading Charts (https://multitradingcharts.com/), an innovative, browser-native solution that democratizes access to professional-grade multi-chart layouts. Developed as a 100% free utility, it seamlessly integrates live TradingView grids without demanding any account registration or recurring fees. This review delves into how Multi Trading Charts empowers a more comprehensive and efficient approach to cross-market analysis.
Understanding Multi Trading Charts
Crafted by the Appzilla Team, Multi Trading Charts functions as a highly responsive, web-based dashboard designed to stream and display up to 16 live financial charts concurrently. By leveraging the robust TradingView embed ecosystem, the platform effectively bridges the operational gap between sophisticated institutional terminals and the accessibility requirements of independent traders.
Core Specifications
| Feature Category | Platform Detail |
|---|---|
| Cost Structure | Completely Free (No hidden fees or tiered subscriptions) |
| Access Requirements | No registration or login needed; instant browser deployment |
| Maximum Chart Layout | Up to a 4x4 grid matrix (16 individual chart windows) |
| Supported Markets | Cryptocurrencies (spot and futures), Global Stocks (NYSE/NASDAQ), Forex pairs, Major Indices, Commodities |
| Primary Charting Engine | Official TradingView Widgets |
Key Analytical Advantages
1. Dynamic Grid Configurations
The hallmark of Multi Trading Charts is its unparalleled flexibility in screen real estate management. Users can transcend the limitations of single-tab viewing by creating highly customized grid matrices:
- Adaptive Layouts: Options range from fundamental dual-chart splits (2x1) and conventional quadrant views (2x2) to advanced nine-chart arrays (3x3) and extensive institutional-scale monitoring (4x4).
- Intuitive Management: Each chart window includes dedicated controls for adding new tickers or instantly minimizing or removing existing viewports, streamlining the analytical workflow.
2. Integrated Multi-Timeframe and Cross-Asset Analysis
The platform’s direct link to real-time market data facilitates integrated analysis across diverse financial instruments:
- Granular Trend Decomposition: Traders can simultaneously observe a single asset’s price action across multiple timeframes—for instance, Bitcoin’s Daily, 4-Hour, 1-Hour, and 15-Minute charts—to identify confluence or divergence in trends.
- Correlation Tracking: Users can dedicate specific grid slots to highly correlated assets, such as Bitcoin and Ethereum, while simultaneously monitoring key macro indicators like the DXY (US Dollar Index) or the S&P 500 to gauge broader market sentiment and liquidity shifts.
3. Expedited Symbol Discovery and Deployment
Multi Trading Charts simplifies the process of adding new assets, eliminating the need for manual code manipulation. Its integrated Smart Symbol Search Popup allows users to quickly input a desired ticker (e.g., BTCUSDT, ETHUSDT, EURUSD), search the comprehensive asset index, and deploy the corresponding chart directly into their chosen grid slot.
4. Optimized Visuals and Individual Controls
Recognizing the 24/7 nature of financial markets, the dashboard incorporates a native Dark Mode toggle. This feature re-renders the entire interface in a true black aesthetic, significantly reducing eye strain during prolonged monitoring sessions. Furthermore, each independent chart window offers rapid shortcuts, including a "Fullscreen" option for focused analysis and immediate return to the grid view.
Streamlining Your Multi-Chart Trading Cockpit
Setting up a personalized, multi-market analysis environment on Multi Trading Charts is designed for speed and simplicity:
- Access the Platform: Navigate directly to https://multitradingcharts.com/home.
- Define Grid Dimensions: Utilize the on-screen inputs to select or type the desired number of columns and rows for your optimal viewport density.
- Populate Charts: Click into any active grid segment, activate the integrated search modal, and select your preferred cryptocurrency pairs, forex instruments, or stock tickers for immediate display.
- Enhance Visuals: Engage the dark theme toggle for superior contrast and reduced visual fatigue during extended charting periods.
Summary
Multi Trading Charts stands as a compelling solution for traders who require extensive multi-chart capabilities without the burden of subscription fees. Its robust integration with TradingView, coupled with a highly intuitive, browser-based interface, provides a powerful and private analytical environment. For active day traders, scalpers, and technical analysts who prioritize comprehensive market oversight and cross-asset correlation tracking, this free utility offers an indispensable foundation for informed decision-making.
Resources
- Multi Trading Charts: https://multitradingcharts.com/
- Let's Chat Crypto: https://letschatcrypto.com/multi-trading-charts-review (Publisher of this article's brief)
- Appzilla Team: Developers of Multi Trading Charts (as mentioned on the platform's introductory information).
Top articles
You can now watch HBO Max for $10
Latest articles
You can now watch HBO Max for $10
Similar posts



This is a page that only logged-in people can visit. Don't you feel special? Try clicking on a button below to do some things you can't do when you're logged out.
Example modal
At your leisure, please peruse this excerpt from a whale of a tale.
Chapter 1: Loomings.
Call me Ishmael. Some years ago—never mind how long precisely—having little or no money in my purse, and nothing particular to interest me on shore, I thought I would sail about a little and see the watery part of the world. It is a way I have of driving off the spleen and regulating the circulation. Whenever I find myself growing grim about the mouth; whenever it is a damp, drizzly November in my soul; whenever I find myself involuntarily pausing before coffin warehouses, and bringing up the rear of every funeral I meet; and especially whenever my hypos get such an upper hand of me, that it requires a strong moral principle to prevent me from deliberately stepping into the street, and methodically knocking people's hats off—then, I account it high time to get to sea as soon as I can. This is my substitute for pistol and ball. With a philosophical flourish Cato throws himself upon his sword; I quietly take to the ship. There is nothing surprising in this. If they but knew it, almost all men in their degree, some time or other, cherish very nearly the same feelings towards the ocean with me.
Comment