Hedera (HBAR) Navigates Critical $0.09 Support as Declining Revenue Casts Shadow on Upside Potential
Introduction: HBAR's Critical Juncture
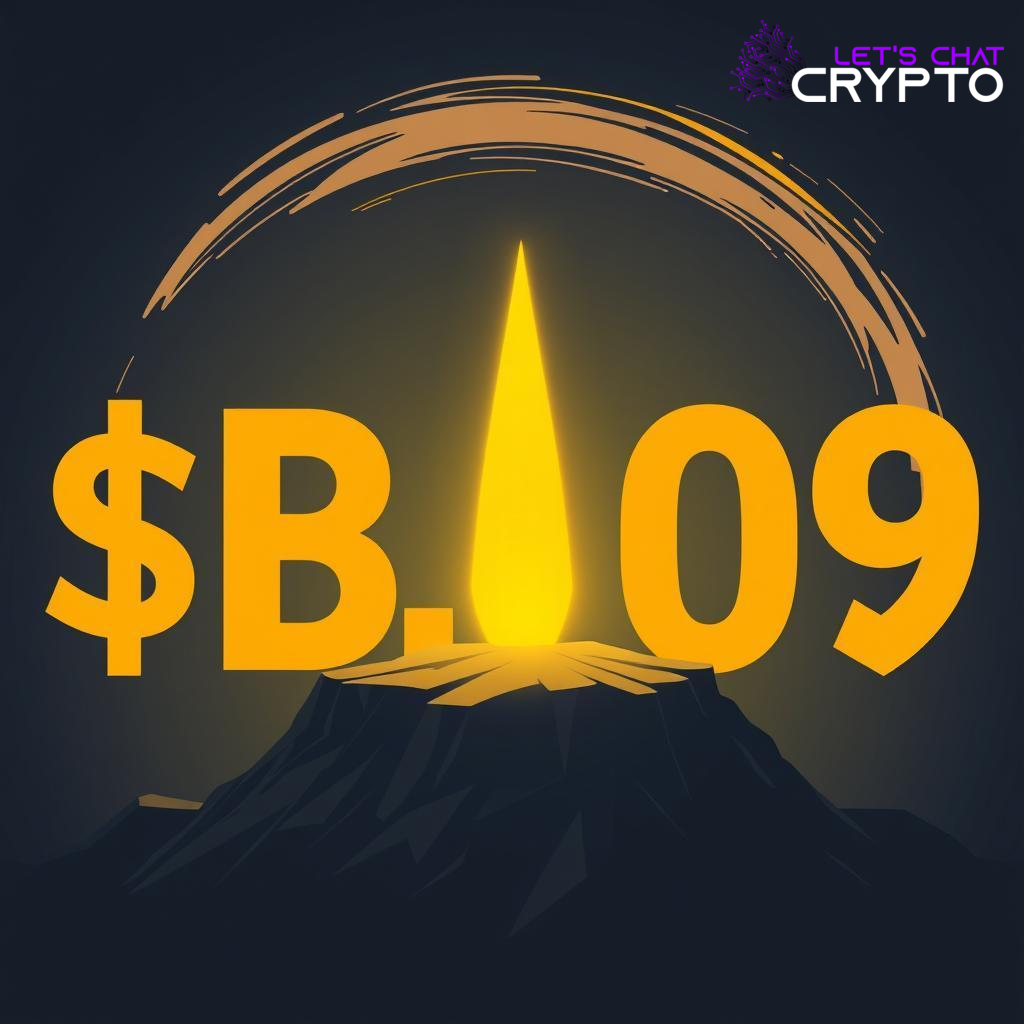
Hedera's native token, HBAR, currently finds itself at a pivotal technical support level, trading around the $0.09 mark. While the token experiences occasional short-term price movements, broader momentum remains subdued. This comes as critical network revenue and other ecosystem metrics show signs of decline, potentially undermining investor confidence and limiting upside momentum.
Live market data indicates HBAR is trading near $0.094, with a market capitalization hovering around $3.9 billion. Daily trading volumes reflect a modest level of activity at these price points, consistent with a period of consolidation. The daily chart for HBARUSD generally points towards a downside trend, suggesting prevailing bearish sentiment.
Technical Resilience Meets Bearish Pressure
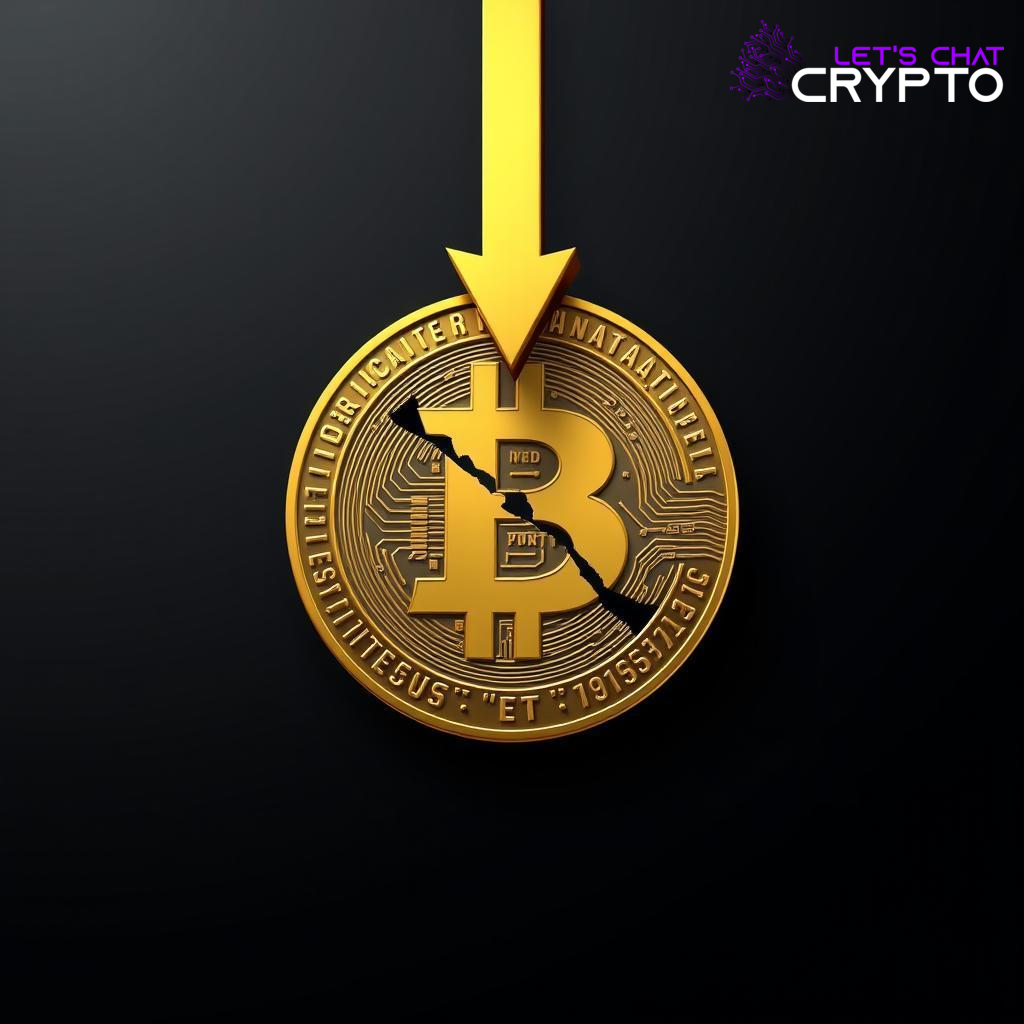
Over recent weeks, HBAR's price action has largely been corrective, oscillating within a range close to its October lows. Analysts observing the charts note that the critical $0.088–$0.09 zone has consistently acted as a support buffer, preventing further significant drops. However, the overarching trend remains bearish as long as HBAR struggles to trade above key resistance levels, which are identified between $0.126 and $0.177.
On shorter-term timeframes, some market participants have identified a potential inverse head-and-shoulders pattern. A confirmed breakout above the $0.094–$0.096 range, if realized, could open the door for a rally towards the $0.12 mark. Yet, this scenario demands clear confirmation through substantial buying momentum, which currently appears limited.
Technical indicators present a mixed, yet predominantly cautious, outlook. The Relative Strength Index (RSI) is hovering near oversold territory, often signaling that a rebound could be imminent. Conversely, momentum oscillators such as the Moving Average Convergence Divergence (MACD) remain skewed to the downside, reinforcing the bearish structural bias. Traders emphasize that until HBAR can convincingly regain and sustain positions above its 20-day, 50-day, and longer-term moving averages, the structural bias is likely to remain negative.
Ecosystem Dynamics: A Decline in Core Activity
Beyond immediate price action and technical charts, the underlying health of the Hedera network, as reflected in its on-chain ecosystem data, presents a more concerning picture. The Total Value Locked (TVL) within Hedera's decentralized finance (DeFi) layer has seen a significant drop from its earlier highs. Concurrently, weekly decentralized application (dApp) revenue has experienced a sharp decline over recent weeks, indicating cooling activity and potentially reduced utility or demand for network resources.
Institutional engagement, often a catalyst for significant price movements in the broader crypto market, also appears muted for HBAR-linked products. In contrast to more robust demand observed for certain other altcoin exchange-traded funds (ETFs), HBAR has shown limited recent inflows from larger participants. A sustained lack of fresh capital from institutional investors could further temper potential price advances, particularly if overall market uncertainty persists.
Outlook and Strategic Levels
The confluence of resilient technical support at critical levels and weakening fundamental metrics from the ecosystem points to a near-term range-bound outlook for HBAR. Downside risks remain, with the potential for HBAR to test support levels around the low $0.08s if selling pressure intensifies. For a decisive shift in both sentiment and technical bias, a sustained breakout above immediate resistance levels would be a prerequisite.
Summary
Hedera's HBAR token is currently holding a crucial support level around $0.09, demonstrating some technical resilience. However, this stability is challenged by a noticeable decline in network revenue and broader ecosystem activity, including reduced TVL and dApp engagement. Technical indicators offer a mixed outlook, with a prevailing bearish bias reinforced by limited institutional interest. A sustained recovery hinges on a clear breakout above key resistance levels and a reversal in the declining fundamental metrics.
Resources
- TradingView (for price charts and technical analysis)
- DeFiLlama (for Total Value Locked data and DeFi metrics)
- CoinMarketCap (for broader market capitalization and trading volume data)
Details
Author
Top articles


 }})
You can now watch HBO Max for $10
Latest articles


You can now watch HBO Max for $10
Introduction: HBAR's Critical Juncture
Hedera's native token, HBAR, currently finds itself at a pivotal technical support level, trading around the $0.09 mark. While the token experiences occasional short-term price movements, broader momentum remains subdued. This comes as critical network revenue and other ecosystem metrics show signs of decline, potentially undermining investor confidence and limiting upside momentum.
Live market data indicates HBAR is trading near $0.094, with a market capitalization hovering around $3.9 billion. Daily trading volumes reflect a modest level of activity at these price points, consistent with a period of consolidation. The daily chart for HBARUSD generally points towards a downside trend, suggesting prevailing bearish sentiment.
Technical Resilience Meets Bearish Pressure
Over recent weeks, HBAR's price action has largely been corrective, oscillating within a range close to its October lows. Analysts observing the charts note that the critical $0.088–$0.09 zone has consistently acted as a support buffer, preventing further significant drops. However, the overarching trend remains bearish as long as HBAR struggles to trade above key resistance levels, which are identified between $0.126 and $0.177.
On shorter-term timeframes, some market participants have identified a potential inverse head-and-shoulders pattern. A confirmed breakout above the $0.094–$0.096 range, if realized, could open the door for a rally towards the $0.12 mark. Yet, this scenario demands clear confirmation through substantial buying momentum, which currently appears limited.
Technical indicators present a mixed, yet predominantly cautious, outlook. The Relative Strength Index (RSI) is hovering near oversold territory, often signaling that a rebound could be imminent. Conversely, momentum oscillators such as the Moving Average Convergence Divergence (MACD) remain skewed to the downside, reinforcing the bearish structural bias. Traders emphasize that until HBAR can convincingly regain and sustain positions above its 20-day, 50-day, and longer-term moving averages, the structural bias is likely to remain negative.
Ecosystem Dynamics: A Decline in Core Activity
Beyond immediate price action and technical charts, the underlying health of the Hedera network, as reflected in its on-chain ecosystem data, presents a more concerning picture. The Total Value Locked (TVL) within Hedera's decentralized finance (DeFi) layer has seen a significant drop from its earlier highs. Concurrently, weekly decentralized application (dApp) revenue has experienced a sharp decline over recent weeks, indicating cooling activity and potentially reduced utility or demand for network resources.
Institutional engagement, often a catalyst for significant price movements in the broader crypto market, also appears muted for HBAR-linked products. In contrast to more robust demand observed for certain other altcoin exchange-traded funds (ETFs), HBAR has shown limited recent inflows from larger participants. A sustained lack of fresh capital from institutional investors could further temper potential price advances, particularly if overall market uncertainty persists.
Outlook and Strategic Levels
The confluence of resilient technical support at critical levels and weakening fundamental metrics from the ecosystem points to a near-term range-bound outlook for HBAR. Downside risks remain, with the potential for HBAR to test support levels around the low $0.08s if selling pressure intensifies. For a decisive shift in both sentiment and technical bias, a sustained breakout above immediate resistance levels would be a prerequisite.
Summary
Hedera's HBAR token is currently holding a crucial support level around $0.09, demonstrating some technical resilience. However, this stability is challenged by a noticeable decline in network revenue and broader ecosystem activity, including reduced TVL and dApp engagement. Technical indicators offer a mixed outlook, with a prevailing bearish bias reinforced by limited institutional interest. A sustained recovery hinges on a clear breakout above key resistance levels and a reversal in the declining fundamental metrics.
Resources
- TradingView (for price charts and technical analysis)
- DeFiLlama (for Total Value Locked data and DeFi metrics)
- CoinMarketCap (for broader market capitalization and trading volume data)
Top articles
You can now watch HBO Max for $10
Latest articles
You can now watch HBO Max for $10
Similar posts


This is a page that only logged-in people can visit. Don't you feel special? Try clicking on a button below to do some things you can't do when you're logged out.
Example modal
At your leisure, please peruse this excerpt from a whale of a tale.
Chapter 1: Loomings.
Call me Ishmael. Some years ago—never mind how long precisely—having little or no money in my purse, and nothing particular to interest me on shore, I thought I would sail about a little and see the watery part of the world. It is a way I have of driving off the spleen and regulating the circulation. Whenever I find myself growing grim about the mouth; whenever it is a damp, drizzly November in my soul; whenever I find myself involuntarily pausing before coffin warehouses, and bringing up the rear of every funeral I meet; and especially whenever my hypos get such an upper hand of me, that it requires a strong moral principle to prevent me from deliberately stepping into the street, and methodically knocking people's hats off—then, I account it high time to get to sea as soon as I can. This is my substitute for pistol and ball. With a philosophical flourish Cato throws himself upon his sword; I quietly take to the ship. There is nothing surprising in this. If they but knew it, almost all men in their degree, some time or other, cherish very nearly the same feelings towards the ocean with me.
Comment